The following is an introduction to the image segmentation of PCB printed circuit boards:
1 Frontier
Threshold segmentation plays a crucial role in image preprocessing. Its core function is to establish a threshold for each pixel, determining whether it belongs to the foreground or background. Currently, numerous threshold processing methods exist, including global and local thresholding. Global thresholding is the simplest approach, while local thresholding divides the entire image into several sub-images, each employing a distinct threshold for segmentation.
This paper analyzes the algorithm and introduces an enhanced adaptive threshold selection method based on this analysis. Practical applications have demonstrated that this method is straightforward, computationally efficient, rapid, statistically accurate, and capable of promptly determining the image threshold. The segmentation results for PCB images are impressive. After segmentation, the target graphics remain intact, and subsequent image enhancement makes open circuits and short circuits clearer and more pronounced, effectively setting the stage for further image processing.
2 Algorithm theory
Adaptive threshold segmentation algorithm:
(1) Divide the image into 4 sub-images;
(2) Calculate the mean value of each sub-image;
(3) Set the threshold value based on the mean value, applying it only to the relevant sub-image;
(4) Each sub-block is segmented according to this threshold.
In this algorithm, the average value serves as the threshold for each sub-block. The gray distribution characteristics of printed circuit boards exhibit the following features:
(1) There are distinct peaks for both the background and the target;
(2) These peaks are widely spaced, with the gray values in between remaining relatively constant, lacking any significant troughs;
(3) The gray level variations of both background and target pixels are continuous, with the target boundary displaying a gradual change rather than a sudden shift.
Practical experience indicates that this algorithm is not optimal for printed circuit boards, as the segmentation results are often subpar. This is due to the fact that the average gray level does not always correspond to the histogram trough, and a significant portion of the PCB histogram can be flat, including areas with a gray level of zero. To accurately segment the PCB image, it is essential to identify an alternative effective method. It’s important to note that the average gray value lies between the two peak values (i.e., the average gray value) and is close to the trough. Therefore, identifying the minimum point in this vicinity is crucial. To segment the PCB target image, first identify the target peak in the histogram, then locate the minimum value point, followed by finding the background peak. This minimum value point serves as the segmentation threshold, with a gray scale selected near both the target and background peaks. These values are used as thresholds for enhancing open and short circuits. In PCB images, targets may vary from sparse to dense. While locating the maximum point in the histogram is relatively straightforward, determining whether this peak represents the background or target peak is key to the analysis.
In a typical PCB image, the target (copper wire) is represented by a high gray scale, while the background is represented by a low gray scale. Below is a feasible method for threshold search:
(1) Identify the gray value corresponding to the largest peak by finding the maximum of f(H) over the full gray interval [0, 255], denoted as H;
(2) Calculate the average gray level of the image;
(3) Determine whether the peak is a background peak or a target peak:
Select the minimum value point by finding the minimum in the neighborhood of 30 around the average point, corresponding to Hmin.
Note: The neighborhood size can be adjusted based on actual conditions.
The second peak point is established as follows:
If only the background peak Hb is found in (3), locate the minimum of f(H) within the gray interval [Hmin, 255), identifying the target peak point Hf;
If the target peak Hf is identified in (3), locate the minimum of f(H) within the gray interval [0, Hmin], identifying the background peak Hb;
(6) Use Hmin as the threshold for image segmentation;
Find a gray level (typically Hb+10) just to the right of the background peak Hb for short-circuit enhancement;
Find a gray level (generally Hf-10) just to the left of the target peak Hf for open-circuit enhancement.
Note: This algorithm is particularly suited for continuous histogram images. For discontinuous histograms, perform adjacent interpolation to convert them into continuous graphs, then apply the above method to determine the threshold.
3 Experimental Results
When noise is present in the PCB image, two common approaches are typically employed:
(1) Filtering followed by binarization, which can result in the loss of significant edge detail, compromising statistical accuracy;
(2) No processing, leading to numerous small noise artifacts in the image, which also affects statistical precision.
To ensure accurate statistical results, it’s vital to avoid losing edges or reducing line width due to filtering, while also preventing noise points from being misclassified as lines in the analysis. A more effective approach is to perform binarization first, followed by noise removal.
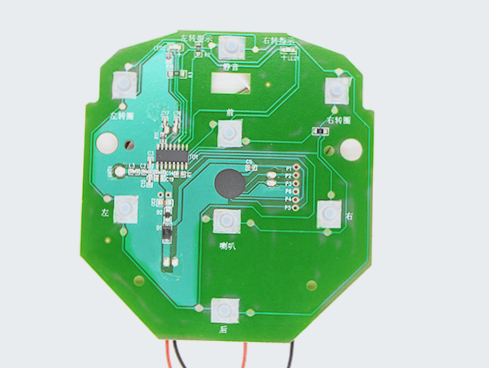
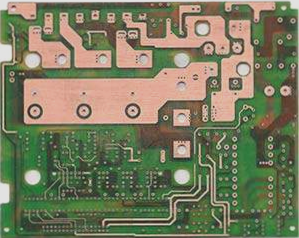
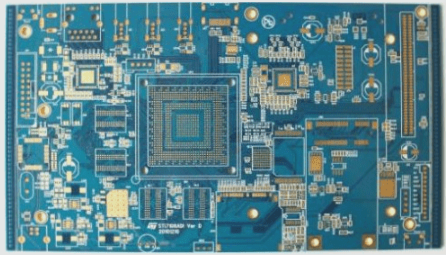
In this experiment, the PCB image captured by the camera was relatively clear with minimal noise, allowing for direct processing.
The experimental results demonstrate that this method is practical, efficient, and straightforward.

